While most people in the U.S. and Europe are familiarized with graphs and charts during their secondary education, it is the rare person who continues to use this skill throughout the rest of their working life. In later life, the vast majority of these people become unaccustomed to the information being conveyed in these charts and merely accept them on faith.
Unscrupulous media outlets, propagandists, activist groups and others rely on this fact and create false impressions with them. More sophisticated users understand that this occurs but are still not competent to identify the fallacies.
Here are a few of the most common deceptions to watch out for:
Truncated Y-Axis
One of the more common manipulations, the truncated Y-axis is always indicated on a reputable graph with a “squiggly” line near the bottom. This seemingly insignificant item indicates that the graph is not to scale and should be judged as such. Less than competently produced graphs will set the scale on the Y-axis to what ever values tells their side of the story. Pay attention to the actual values and you should have no trouble discerning any disparities between the graph and the numbers.

Changing Axes
Any graph can be manipulated by simply changing the ratio of the X and Y axes. In particular, spreading the Y-axis will yield a less steep slope making the info appear less dire while the opposite – that is, shrinking the length of the Y-axis can dramatically increase the slope of the line. This manipulation is usually seen when graphs of similar information are being compared – for instance, crime statistics from one year to the next or from one city to another.
Cumulative Vs. Iterated Time Periods
Used mostly by those who have only mediocre news to tell, cumulative graphs are the simplest form of deceptive charts as they always go “up and to-the-right” which typically means that things are getting better. Unfortunately, the true data is not always so sanguine.
For example, a company with flat or falling sales on a quarter-to-quarter basis would graph cumulative sales over the entire time period to lull their investors and possibly the board of directors into thinking that things are going well.

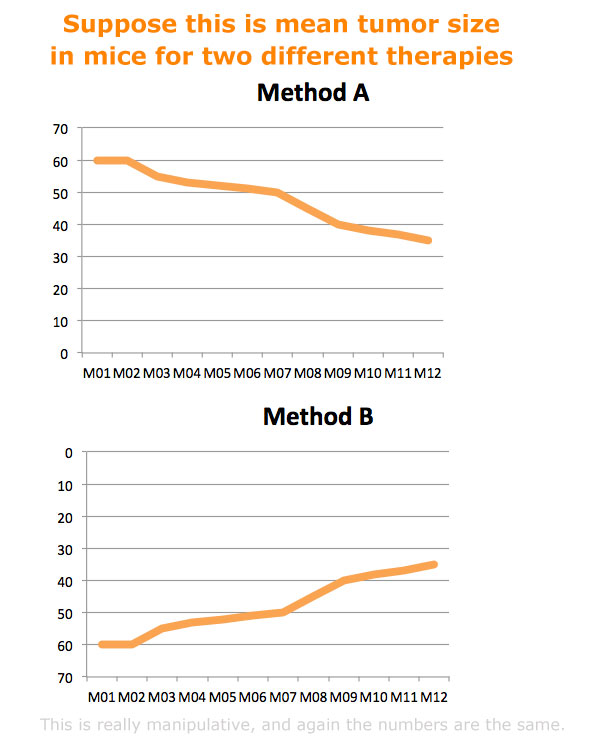
Non-Conventional Graphs
Even more deceptive are the graphs that turn data visualization conventions – figuratively and literally – on their heads. While some graphic designers will add a third dimension for aesthetic purposes, others use it to simply cloud the reader’s perception.
More egregious still is the inversion of a graph so that the reader gets a false impression of a positive trend even though the actual data indicates a negative one.
Omitting Data
Data visualization is most often used to identify and clarify trends as they appear in a data set. Some creators “cherry-pick” their data points – leaving out the ones that do not bolster their position or their conclusion – thus creating a false trend that is not borne out by the entire set of data. An simple example is using growth data from up years while ignoring any down ones. While the overall trend will be the same, the graph with the expurgated chart will show less volatility.
Logarithmic Scales
Charts that include a logarithmic scale are used when the range of values is extremely large. For instance, this type of graph would be useful if comparing the sales volume of lower end oil producers as compared to Royal Dutch Shell. The problem occurs when the scale is used to occlude valuable data by mashing it together in a meaningless pile.

A Few Key Questions to Ask
As you can see, there are a multitude of ways to self-servingly manipulate data visualizations. This fact does not mean that all hope is lost for those unfamiliar with graphs but you must exercise a little caution when first viewing a chart. Here are a few questions to ask so that you are not overwhelmed by even the most complicated graph.
For example, with bar charts, examine the Y-axis. Does it start at zero and are the units in every chart similar in proportion? Find that squiggly line and understand its relevance. On pie charts, ask yourself if the numbers add up to 100%. If not, is there some inconvenient data missing or have some been crowded together to diminish their importance.
On graphs with cumulative statistics, ask why the iterated ones were not used of they indicated an upward trend. This is an especially awkward question to respond to if the data is not as good as expected. If given the runaround, just ask for the “raw” data and do the math yourself. In most cases, it’s only simple addition and subtraction.
Finally, beware of “pretty” charts with lots on non-essential elements. These charts are intentionally designed to draw your attention away from the true facts. In this hectic business climate, who has time for these shenanigans if not someone with something to hide?

Recent Comments